Pearson Edexcel · A-Level · Economics B
Course version: 9EB0 · Version from Sept 2015
Appendix 3: Quantitative skills: QS 5: calculate and interpret index numbers
Index numbers express economic data relative to a base year, which is assigned a value of 100.
Checked against the Pearson Edexcel 9EB0 specification (opens in a new tab) on .
- Point 4 of 7
- 4 key terms
Study notes
From the checked teaching notes for this specification point.
The idea
Index numbers express economic data relative to a base year, which is assigned a value of 100. This enables easy comparison of changes over time, such as inflation or economic growth. To calculate an index number, divide the raw value for the target year by the raw value in the base year, then multiply by 100. For example, if a basket of goods costs £400 in the base year and £440 in the current year, the index is (440 / 400) × 100 = 110. Interpreting this index reveals prices have risen by 10% since the base year. When interpreting index numbers, remember that a slower rate of increase (e.g., an index rising from 110 to 115 instead of 100 to 110) means the underlying value is still growing, just at a slower pace.
What earns the marks
- Identify the base year and its raw value from the provided data.
- Apply the formula: (Current Year Value / Base Year Value) × 100.
- State the calculated index number accurately, usually to one decimal place unless specified otherwise.
- Interpret the change by comparing the calculated index to the base of 100 to determine the percentage change.
Common mistakes and how to put them right
Calculating the percentage change between two non-base years by simply subtracting the index numbers.
Put it right: Calculate the percentage change using the formula ((New Index - Old Index) / Old Index) × 100.
Assuming a falling index number always means a negative raw value.
Put it right: A falling index number means the raw value is decreasing relative to the previous period, but it remains positive.
Forgetting to multiply by 100 when calculating the index number.
Put it right: Multiply the ratio of the current value to the base value by 100 to find the index.
Exam tips
- Always check which year is designated as the base year (Index = 100) before starting your calculations.
- When asked to interpret an index number, explicitly state what the change means in context, such as 'prices have increased by X%'.
- Use index numbers to support your analysis in extended responses, particularly when comparing the relative performance of different economic indicators.
Try the lesson
The start of the Appendix 3: Quantitative skills: QS 5: calculate and interpret index numbers lesson, made from checked teaching notes for this specification point.
Have a go first
A basket of goods costs £40 in the base year of 2020. In 2023, the same basket of goods costs £50. What is the price index for this basket of goods in 2023?
Listen
Index numbers express economic data relative to a base year, which is assigned a value of 100. This enables easy comparison of changes over time, such as inflation or economic growth. To calculate an index number, divide the raw value for the target year by the raw value in the base year, then multiply by 100. For example, if a basket of goods costs £400 in the base year and £440 in the current year, the index is (440 / 400) × 100 = 110. Interpreting this index reveals prices have risen by 10% since the base year. When interpreting index numbers, remember that a slower rate of increase (e.g., an index rising from 110 to 115 instead of 100 to 110) means the underlying value is still growing, just at a slower pace. A strong answer earns marks for these points. Identify the base year and its raw value from the provided data. Apply the formula: (Current Year Value / Base Year Value) × 100. State the calculated index number accurately, usually to one decimal place unless specified otherwise. Interpret the change by comparing the calculated index to the base of 100 to determine the percentage change. A common slip: Calculating the percentage change between two non-base years by simply subtracting the index numbers. Instead, Calculate the percentage change using the formula ((New Index - Old Index) / Old Index) × 100. Exam tip: Always check which year is designated as the base year (Index = 100) before starting your calculations.
See it
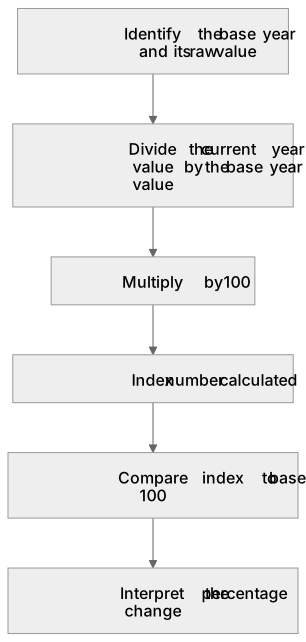
Put it in order
Put these steps in the order they happen.
- 1. Multiply by 100
- 2. Divide the current year value by the base year value
- 3. Identify the base year and its raw value
- 4. Interpret the percentage change
- 5. Compare index to base of 100
- 6. Index number calculated
Key words
Say what each word means before you turn the card.
Index numbers
Try answering aloud or in your head before turning the card.
Base year
Try answering aloud or in your head before turning the card.
Inflation measurement
Try answering aloud or in your head before turning the card.
Data interpretation
Try answering aloud or in your head before turning the card.
See every definition
- Index numbers
- Values that express economic data relative to a base year, which is assigned a value of 100, enabling easy comparison of changes over time.
- Base year
- The year against which other years are compared, assigned a value of 100, whose raw value is divided into the target year's raw value.
- Inflation measurement
- Using index numbers to compare changes over time, where interpreting an index reveals prices have risen by a percentage since the base year.
- Data interpretation
- Reading an index number to determine the percentage change from the base of 100, remembering a slower rate of increase still means the underlying value is growing.
Label the diagram
Some boxes have lost their names. Pick the right name for each number.
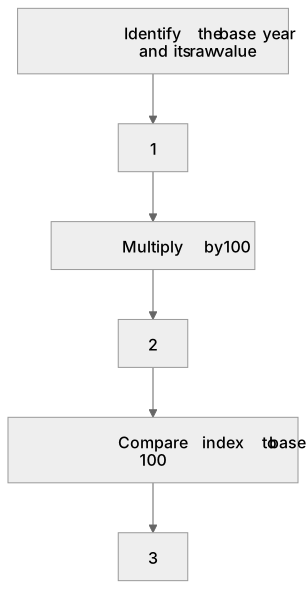
1Box 1
2Box 2
3Box 3
There is more to this lesson
The full lesson goes on to check your understanding and help you earn the marks. Create a free account to carry on, with your progress saved.
A week of Premium from your first lesson · Then the free plan continues · No card, no charge
Test your understanding of Appendix 3: Quantitative skills: QS 5: calculate and interpret index numbers
Active recall beats re-reading. Take an instant quiz now to test what you’ve learned and lock it into long-term memory.
A week of Premium from your first lesson · Then the free plan continues · No card, no charge